With the help of satellite images from the European Copernicus project, open urban and settlement data, and AI, Husqvarna has analyzed green areas in 344 cities in 62 countries across all inhabited continents. In addition to visible color, the satellite measures other spectra.
So we can analyze things we can't see with the naked eye to understand what is vegetation and what isn't. Something can be painted green, or an artificial turf. Then we remove it. A lawn can be dry and quite brown, but it's still counted as vegetation, explains report author Erik Swan at Husqvarna.
Weather and New Construction
Compared to the previous year, 158 million square meters of green areas have disappeared from cities in one year, mainly due to new construction. On the other hand, 95 million new green areas have emerged, mostly grass.
In total, the development means that each city has lost green areas equivalent to 23 football fields.
87 cities are bucking the trend. Residents of Melbourne in Australia, Dar es Salaam in Tanzania, Wuhan in China, Rome in Italy, Denver in the USA, Mumbai in India, and Santiago in Chile can rejoice in living in significantly greener cities than they did last year.
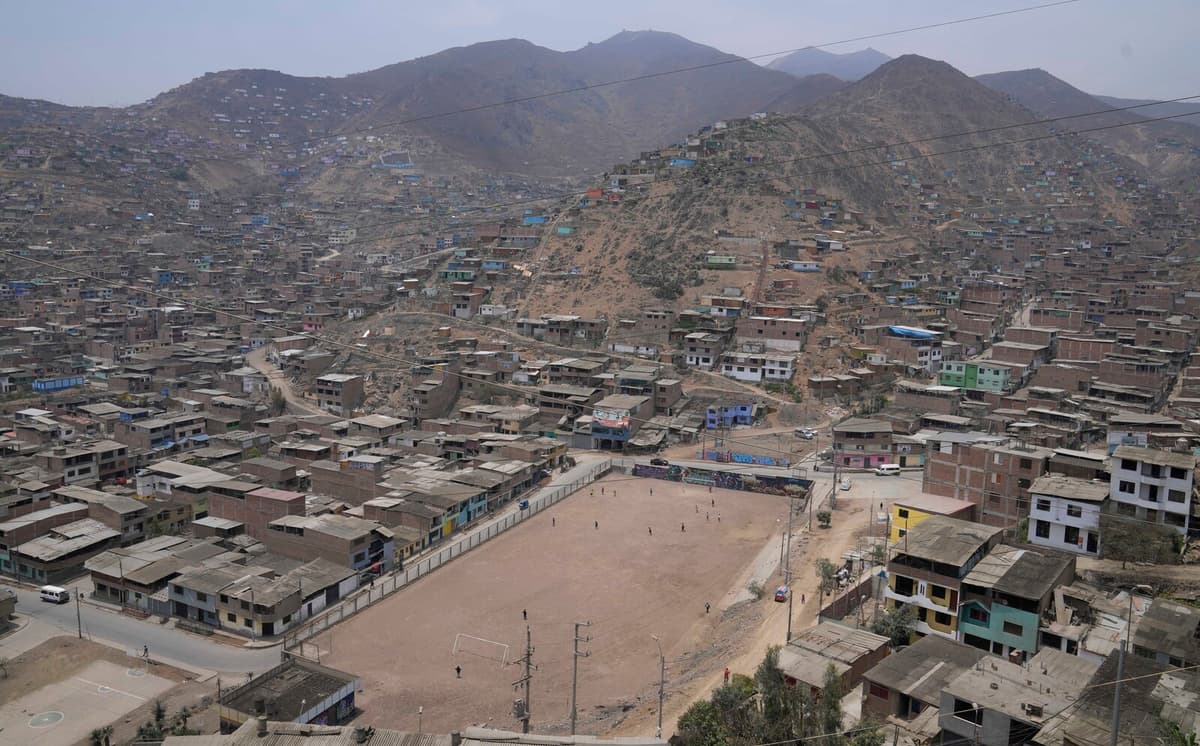
But when cities become greener, it's more due to the weather than the cities planning new green areas. Santiago, for example, can boast 9.8 million square meters more greenery than the previous year. This is due to unusual amounts of rainfall in 2023, which have caused the normally dry areas to sprout.
It's the undergrowth, grass, and other things that have bloomed, says Erik Swan.
Less Green in Sweden
In Europe, Vilnius in Lithuania stands out as the continent's greenest capital with 61 percent green area, and also the highest per capita (226 square meters).
Stockholm, in comparison, has 46 percent green area, and only 88 square meters per capita. Sweden's 20 largest cities are generally greener than the global average, but the green area has decreased over the past two years in all cities.
The Hugsi survey has been conducted annually since 2019. The acronym stands for Husqvarna Urban Green Space Insights. Husqvarna describes the project as a kind of market survey, where greener cities can ultimately be good for business.
The report is based on data from ESA satellites Sentinel 2 and measurements taken over a full year, and is based on the period when cities are at their greenest. The figures in this year's survey are therefore based on satellite images taken in 2023.
In addition to satellite images, open data on city boundaries and population centers are used, and the images are analyzed by an AI model trained to recognize different types of green areas.
Over the years, the number of cities being measured has grown, and is now 344.
The total urban area that has changed between 2022 and 2023 is only 0.3 percent. But among the 98 cities that Husqvarna has data on since 2016, a declining trend is seen after an initial increase until 2018.
33.59 percent of cities were green last year, compared to 34.20 percent in 2016.
Between 2016 and 2023, green areas decreased by approximately 7,700 football fields per year, a total of over half a million square meters.


